TV channel analysis and insight
Business Case:
To analyze and tell a story about viewership data for the particular channel. Understanding and viewing trend patterns across markets, channels and content while also comparing them. A proper deep dive into every aspect of the necessary KPIs and GRP ratings.
Solution:
To create a consolidated view of market, channels and performance of the channel and tracking how important KPIs act in a particular region across weeks. Understanding how content and slot timings can affect viewership.
Tech:
Power BI
Data Source:
There are 11 sections to this report.
Index:
An overview page for the rest of the sections and GRP ratings plotted across weeks.

Market Clustering:
Compares different channels in terms of market pan India.

Historic TB Comparison:
This section gives Time Band (TB) wise slots comparison and trend analysis with respect to different channels and weeks.

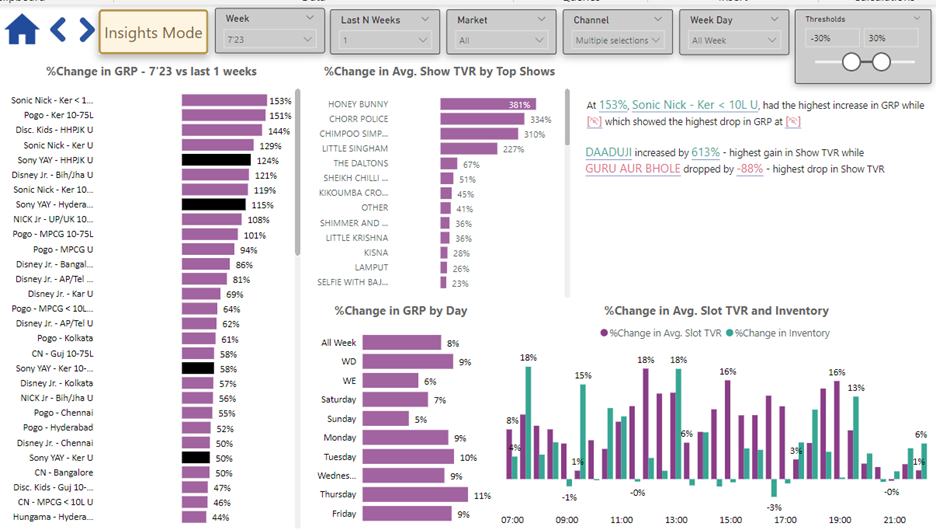
Insights Mode:
Shows changes in GRPs and TVR with respect to content and channel performance.